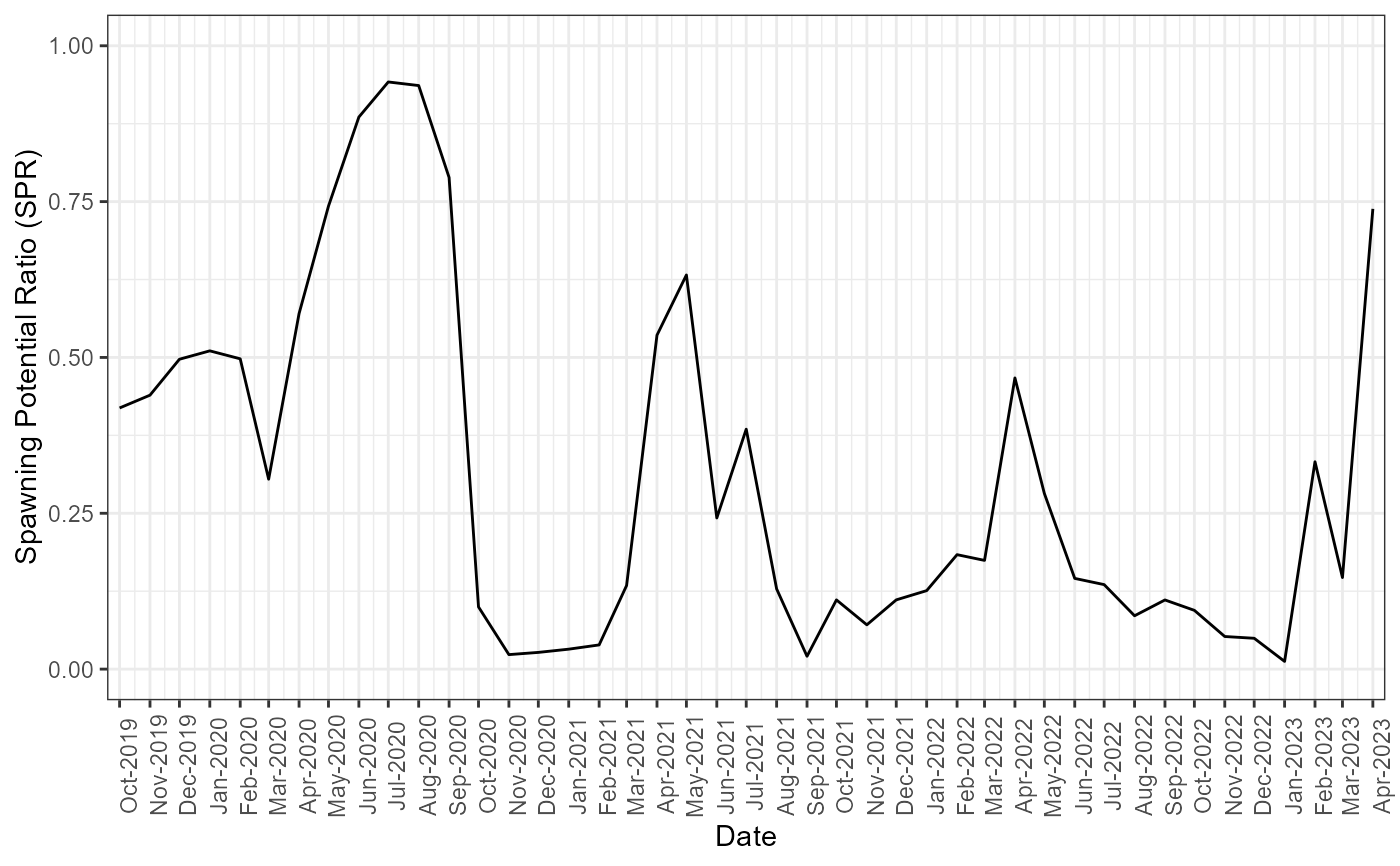
Plot the predicted spawning potential ratio (SPR)
plot_SPR.RdPlot the predicted spawning potential ratio (SPR)
plot_SPR(assess)Arguments
- assess
An object of class
Assess
Value
A list with a data.frame and a ggplot object
Examples
MyData <- Import(Example_Data()[2])
MyAssess <- Assess(MyData)
#> Parameters pass all checks
#> Index, Effort, and Catch detected. Only fitting to Index and Catch. Set `Data$Fit_Effort=1` to fit to Effort as well.
plot_SPR(MyAssess)
